Changing our world view | Why Oikocredit is switching to the Gall-Peters projection map
 19 August 2022
 In this blog, Nina Alff, from Oikocredit Support Association Baden-Württemberg, explains why Oikocredit has decided to switch to the Gall-Peters projection of the world map.
Maps not only represent the world, they shape the way we see it. The Gall-Peters projection map presents all countries in the correct in size in relation to each other. This map is appropriate for Oikocredit because we want to promote a more balanced and less Eurocentric view of the world.
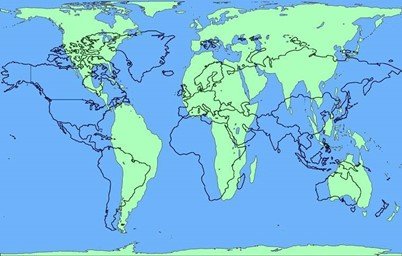
European view of the world: the Mercator projection map
For nearly 500 years, the Mercator projection has been the norm for maps of the world and is still widely used in atlases, school textbooks and universities.
Gerardus Mercator, a Flemish cartographer, developed this map in 1569. Modern cartography had its roots in the European colonialism era, as maps were indispensable for exploring sailors trying to navigate the oceans.
The Mercator map enlarges Europe and puts it in the relative centre of the world map, pushing the equator below.
The Gall-Peters projection map
The Gall-Peters projection map is named after James Gall and Arno Peters. Gall explained the projection in 1855 at a science convention and published a paper on it in 1885. It wasn’t until the 1970s that the projection was introduced to a wider audience.
This map gives priority to the relative proportions of the landmasses. The Gall-Peters map’s main achievement was its revision of the Eurocentrism inherent to Mercator’s map, which in itself is a paradigm shift.
The Gall-Peters map provides a helpful corrective to the distortions of traditional maps. And while this map is more accurate in its portrayal of proportions and sizes, its importance goes far beyond questions of cartographic accuracy, it challenges our view of the world.
Its cartographer, Dr Arno Peters, had criticised Mercator’s map in 1973 by saying, “It over-values the white man and distorts the picture of the world to the advantage of the colonial masters of the time.”
It is undisputed that the Gall-Peters map cannot be surpassed in terms of accuracy. However, no map, including the Gall-Peters map, is completely accurate.
This is because it’s not possible to stretch a 3D shape of the Earth onto a 2D sheet of paper. And it explains why the Gall-Peters map appears to be more narrow than other maps.
Other differences between the Gall-Peters map and the Mercator map
On the Mercator map, the African continent appears to be the same size as Greenland. When in reality, 14 Greenland islands could fit into the African landmass.
The Mercator map also makes South America look similar in size to Europe, when in actuality, South America is almost twice as large. And Finland looks longer from north to south than India, when it is actually the other way round.
The Gall-Peters map, however, cuts the United States, the United Kingdom and Europe down to their appropriate sizes.
Today, the Gall-Peters map is being used more and more in educational and business circles as an icon of the modern concept of world equality.
Equality is at the heart of Oikocredit’s work, and we see using this map as an important step to reflect that.
Nina Alff is responsible for transformative learning at Oikocredit Support Association Baden-Württemberg. She is also a geographer.
Sources
https://www.oxfordcartographers.com/our-maps/peters-projection-map/
Archive > 2022 > August
- 29 August 2022 - Caroline Mulwa appointed as Regional Director for Africa
- 23 August 2022 - Q2 2022 quarterly report: Mixed outcomes as economic uncertainty persists
- 19 August 2022 - Changing our world view | Why Oikocredit is switching to the Gall-Peters projection map
- 10 August 2022 - Reflecting on 2022: 3 Articles to re-read this Summer
